
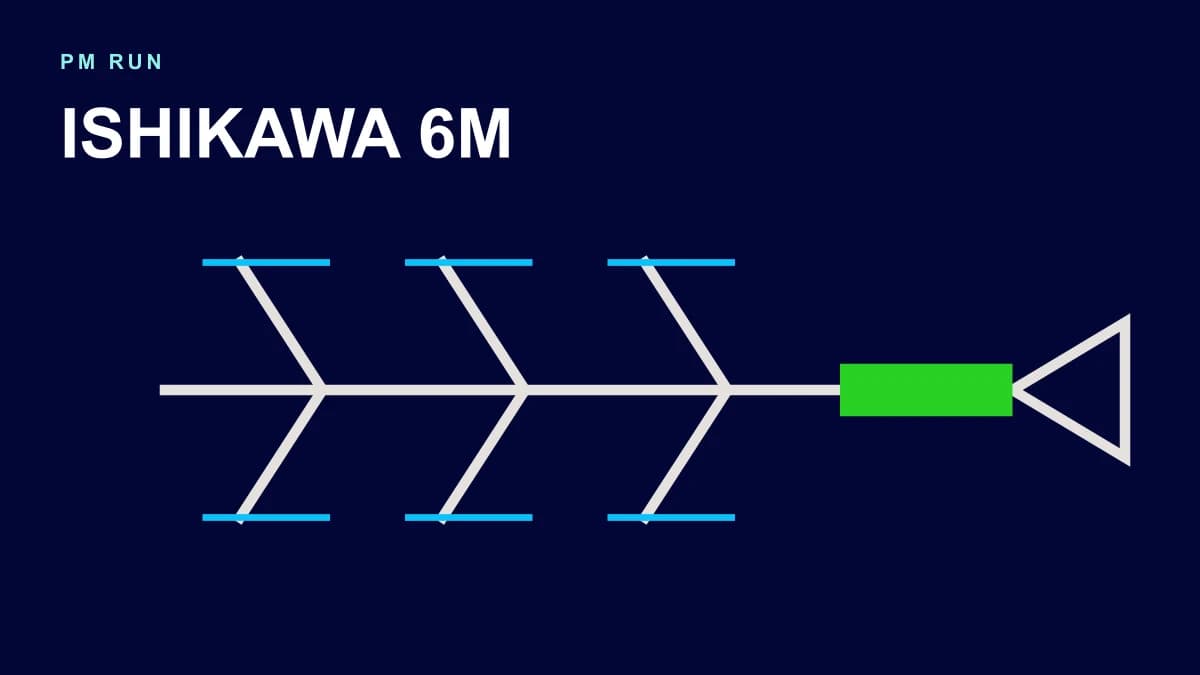
The Ishikawa diagram, also called the fishbone or cause-and-effect diagram, sorts the possible causes of a problem into six categories, the 6Ms: method, machine, material, manpower, measurement and mother nature (environment). In maintenance, it helps the team list hypotheses for a failure before deciding what to test and what to fix.
The diagram does not prove a cause. It widens the team's view so the investigation does not stop at the first explanation raised in the meeting, and it leaves each hypothesis in a form that can be tested. It is one of the most used tools in root cause failure analysis.
What is an Ishikawa diagram
The tool was created by Kaoru Ishikawa, a Japanese engineer who used it in quality programs in the 1960s. The drawing looks like a fish skeleton: the problem (the effect) sits at the head, on the right, and the cause categories branch off the central spine. On each bone, the team writes possible causes and, when needed, sub-causes. ASQ (American Society for Quality) describes the method and the category sets used in manufacturing and services.
The 6Ms of the Ishikawa diagram
The 6Ms are the classic categories for industrial settings. What each one means in maintenance:
Method
How the work is done: assembly procedure, tightening sequence, preventive task list, inspection interval, lubrication instruction. A method cause appears when the procedure is wrong, incomplete or missing.
Machine
The equipment itself and the tools used in the job: wear, design unsuited to the load, looseness, vibration, uncalibrated tools, improvised lifting devices.
Material
Parts, spares and consumables: a bearing with a different specification, wrong or contaminated lubricant, a gasket incompatible with the fluid, a reconditioned part out of tolerance.
Manpower
Skills, experience and working conditions of the people doing the job: technicians not trained on that asset, shift changes without handover, an overloaded crew. The category examines working conditions without turning a person into the culprit.
Measurement
Instruments and data: a badly placed sensor, an uncalibrated thermometer, an ambiguous acceptance criterion, an incomplete record on the work order. Many "no cause found" failures are really measurement failures.
Mother nature (environment)
Conditions around the equipment: temperature, humidity, dust, wash-down water, vibration from nearby machines, corrosive atmosphere.
Some companies use 4M (method, machine, material, manpower) for simpler problems, or 8M, adding management and maintenance as separate categories. The number of categories matters less than the discipline of filling each one with causes that can be verified.
How to build an Ishikawa diagram in maintenance
- Define the effect precisely. "Motor runs hot" is vague. "Motor frame temperature above 90 °C after two hours at rated load" lets everyone discuss the same phenomenon.
- Bring in the people who know the problem. Mechanic, electrician, operator, lubrication technician, planner and, when needed, reliability engineering. An analysis done only by supervisors loses field knowledge.
- List causes by category. Use the asset's work order and notification history instead of memory alone. Write each cause as an observable condition, such as "grease applied above the specified amount" instead of "poor lubrication".
- Drop what the facts already rule out. If the failure happens with any operator, the individual error hypothesis loses strength.
- Rank hypotheses for testing. Consider physical plausibility, ease of checking and risk. Start with cheap, decisive tests.
- Test and record the result. Each hypothesis ends as confirmed, rejected or pending, with the evidence behind the conclusion.
6M Ishikawa example for a maintenance failure
The example below is illustrative and shows how to turn each bone into a testable hypothesis. Effect: recurring overheating of the drive-end bearing on a fan motor.
| Category | Possible cause | How to check |
|---|---|---|
| Method | Regreasing with more grease than recommended | Compare the amount applied with the bearing manufacturer's recommendation |
| Machine | Misalignment between motor and fan | Measure alignment with the set stopped and record the values |
| Material | Grease incompatible with the one used before | Check the grease specification in stock against the lubrication plan |
| Manpower | Technicians on different shifts regreasing with different criteria | Check in the work orders who did the job and how it was recorded |
| Measurement | Temperature sensor mounted where it picks up heat from the frame | Compare with a reference reading taken by thermography |
| Mother nature | Dust entering the bearing housing through a damaged seal | Inspect the seal and the condition of the removed grease |
With the table, the team leaves the meeting with a list of checks instead of a conclusion. If the removed grease is dark and excessive and the seal is intact, the method hypothesis gains weight and the next step is to review the lubrication task list.
From the diagram to a confirmed cause
The most common mistake is treating the finished diagram as the result of the analysis. The meeting produces hypotheses; confirmation comes from testing, measuring or inspecting. A few rules help:
- A cause is accepted only when it explains the observed effect, including when and where it happens.
- Avoid fixing everything at once. If four changes are made together, nobody will know which one worked, and the learning will not carry over to other assets.
- When a hypothesis is confirmed, use the Five Whys to reach the system cause: why was the grease amount wrong? Because the plan did not specify it, or because the specification never reached the technician?
- Record rejected hypotheses too, with the evidence that rejected them. This keeps the same discussion from coming back at the next failure.
Ishikawa, Five Whys and FMEA
The three tools complement each other. Ishikawa opens the range of hypotheses for a problem that has already happened. The Five Whys go deeper into one specific chain until the management cause appears. FMEA works before the failure, listing an asset's possible failure modes and prioritizing preventive actions. For chronic failures, a Pareto chart usually comes before the Ishikawa, to choose which problem deserves the analysis.
The Ishikawa diagram in SAP PM and PM Run
The Ishikawa pays off when the asset history is reliable. In SAP PM, the maintenance notification records object part, damage and cause through catalog codes. When these fields are filled in with care, the team comes to the meeting knowing how many times the same damage occurred, on which assets and with which causes already recorded, and the diagram starts from facts.
The frequent problem is a blank cause field, or a generic code, because the technician records everything at the end of the shift. PM Run Mobility brings notifications to the phone with cause, symptom and object part catalogs, lets the technician attach photos of the part during the inspection and sends the data back to SAP PM. The next investigation starts with better information, and the tests defined in the diagram become work order operations with recorded results. See how the maintenance software integrated with SAP PM works.
Frequently asked questions about the Ishikawa diagram
What are the 6Ms of the Ishikawa diagram?
Method, machine, material, manpower, measurement and mother nature (environment). They are the six categories used to organize the possible causes of an industrial problem.
Are the Ishikawa diagram and the fishbone diagram the same thing?
Yes. Fishbone diagram and cause-and-effect diagram are other names for the Ishikawa diagram, because of the shape of the drawing.
What is the difference between 4M, 6M and 8M?
The number of categories. 4M uses method, machine, material and manpower. 6M adds measurement and mother nature. 8M usually adds management and maintenance. Choose the set that covers the plausible causes of the problem.
Does the Ishikawa diagram show the root cause?
Not on its own. It organizes hypotheses. The root cause is confirmed only after tests, measurements or inspections support one hypothesis and rule out the competing ones.