
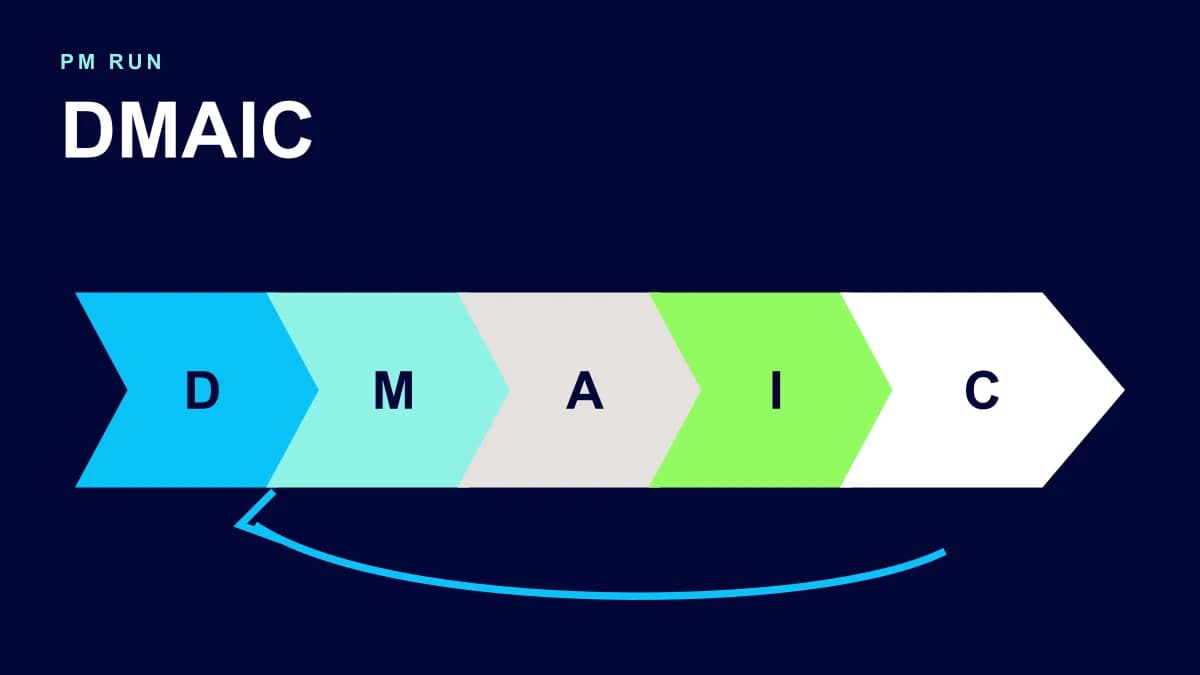
DMAIC provides a disciplined route for maintenance losses that combine chronic variation, uneven data quality, and several credible explanations. Its value depends on an operational definition before counting, a measurement process fit for the decision, causal tests that can fail, and a control plan that exposes regression.
The completed case follows centrifugal transfer pumps P-204 A and B. Mechanical seal failures interrupt product movement, consume corrective capacity, and crowd work out of the preventive schedule. Every asset, number, and finding is instructional. They do not represent a PM Run customer, an industry benchmark, or a promised outcome.
Establish the improvement contract
The project addresses functionally relevant seal leakage after a seal intervention on either pump between January and June. An event is included when it forces a load reduction, shutdown, or corrective order. Moisture without functional effect, leakage from adjacent piping, and work outside the period remain in separate categories. This boundary prevents the count from shifting to support a favored explanation.
The operational defect definition names the technical object, confirmed origin, consequence threshold, time window after maintenance, and source record. In this case, an event counts after inspection confirms leakage at the seal assembly, it occurs within 1,000 operating hours of replacement, and it generates a notification linked to the pump. An unverified origin receives an inconclusive classification rather than being forced into the numerator.
Reliability leads the analysis, mechanical maintenance contributes assembly knowledge, operations provides regimes and starts, planning reconstructs exposure, materials reviews batches and storage, while SAP and IT protect field meaning and extraction lineage. The sponsor approves scope, resources, and decision rights. A phase ends when its evidence requirement is satisfied, not when a meeting date arrives.
| Definition choice | Case decision | Operational consequence |
|---|---|---|
| Loss | Recurring seal leakage after intervention | Other failure modes use their own populations |
| Population | P-204 A and B under the approved common configuration | Different pump families stay outside the baseline |
| Exposure | Operating hours with starts recorded | Calendar months alone cannot support comparison |
| Outcome | Lower recurrence without added safety risk or excessive planned downtime | Balancing measures enter the project charter |
Measure the process that creates the numbers
The initial history contains 14 notifications mentioning leakage, 11 replacement or repair orders, and 8,400 combined operating hours. Technical review confirms nine events under the definition, identifies three piping occurrences, and leaves two without sufficient evidence. The instructional baseline equals 1.07 event per 1,000 hours, based on nine divided by 8,400 and multiplied by 1,000. That figure describes only this population and interval.
Two inspectors independently classify an anonymized sample of records and photographs. Their main disagreement concerns fluid from the seal versus the flush connection. The Measure response is to sharpen the visual criterion, require photographs of defined locations, and repeat classification. If agreement remains inadequate for the intended decision, the team states the limitation and improves future collection instead of manufacturing certainty.
Continuous measurements such as alignment, flush flow, or vibration require an instrument, range, resolution, calibration status, position, method, and operator procedure. A current certificate cannot remove variation introduced by sensor placement or technique. A capability index is withheld when measurement traceability or process stability has not been demonstrated.
The baseline is stratified by pump, crew, seal type, material batch, hours since intervention, starts, operating regime, and presence of a complete alignment report. Stratification protects differences that an overall average would hide. Small counts remain visible beside their denominators rather than receiving decimal detail unsupported by the sample.
Baseline evidence package
- Notification: symptom, time, observed mode, consequence, technical object, and reference to earlier work.
- Order: performed operations, components, materials, dates, crew, and recorded deviations.
- Confirmation: actual time, operation completion, field text, and identifiable rework.
- Technical measurement: alignment, base condition, flush flow, and the acceptance rule current on that date.
- Operating exposure: hours, starts, regime, and downtime caused by unrelated constraints.
Missing fields are not reconstructed as facts. An interview may supply context and guide a test, but it is labeled as a later account. Contemporary evidence remains distinct. This treatment makes gaps useful by showing what the current process cannot yet answer.
Analyze mechanisms, not attractive correlations
A Pareto view shows more events after work that lacks a complete alignment report. The association does not establish misalignment as the cause. The team reconstructs base condition, assembly, alignment, flush connection, start, regime, and leakage appearance. Each hypothesis receives a predicted observation and a possible refutation.
The first hypothesis proposes that residual soft foot moves the assembly after final torque. It predicts a difference between preliminary and post-torque readings concentrated in early failures. A second considers inadequate flush flow in certain regimes. A third examines installation damage. Material batch, suction pressure, and startup sequence remain alternatives until evidence reduces their plausibility.
Six of the nine events follow assemblies without post-torque records. Two opportunities that can be reassessed show movement beyond the internal acceptance criterion. Three conforming interventions run without a repeat event under comparable exposure. This pattern supports a pilot on base preparation and alignment sequence, while falling short of a universal claim about every seal leak.
The escape mechanism receives its own analysis. The instruction requested alignment but did not identify when to measure, the tightening state, the required attachment, or who could reject the work. A defective condition could therefore occur and pass acceptance. The pilot has to control both occurrence and detection.
Improve through a bounded field pilot
The selected change combines base verification, soft-foot correction, alignment after final torque, flush confirmation, and acceptance through an attached reading. Pump P-204 B receives the first controlled intervention. Seal model, supplier, and startup routine remain unchanged so that multiple simultaneous changes do not erase causal learning.
The pilot order separates disassembly, inspection, base correction, assembly, final alignment, and functional test. Each operation identifies skill, instrument, expected reading, stop point, and proof. A value outside the criterion blocks progression, calls the technical owner, and generates a deviation note. Labor confirmation alone cannot accept assembly quality.
Three decision paths are agreed beforehand. Unsafe conditions or an unavailable qualified instrument stop and reschedule the job. Conforming implementation starts the exposure window. Recurrence of the studied mechanism returns the project to Analyze before any family rollout. A few uneventful hours never qualify as sustained effectiveness.
Balancing measures cover planned duration, in-job rework, introduced risk, and availability of qualified staff. A control that reduces recurrence but makes the planned task unworkable needs redesign. Effectiveness, practical execution, and risk control are assessed together.
Observed Improve result
Before intervention, the sponsor approved three instructional decision criteria: at least 3,000 combined operating hours under comparable regimes, no more than 0.40 event of the defined mechanism per 1,000 hours, and a post-torque reading attached to every applicable assembly. For the combined denominator, each pump's clock would start only after it received the full package, with exposure segmented by intervention. Added duration could not exceed 45 minutes per intervention, and any safety deviation would stop the pilot.
Deployment was staged. P-204 B received the package during the first controlled intervention. After that implementation was accepted, P-204 A received the same sequence at its next scheduled intervention. Each pump's exposure clock began at its own deployment: B ran 900 hours until the single event meeting the definition, received a corrective intervention with the package, and accumulated another 900 hours; A accumulated 1,400 hours after its deployment. Pre-package hours were excluded. Therefore, 900 + 900 + 1,400 = 3,200 exposed hours.
The three applicable interventions were the initial P-204 B deployment, the scheduled P-204 A deployment, and the P-204 B correction after the event. Every intervention included a post-torque reading. Added times were 32, 34, and 41 minutes, giving a median of 34, and no safety deviation was attributed to the sequence. Exposure contained one event: 1 divided by 3,200 and multiplied by 1,000 equals 0.3125, reported as 0.31 event per 1,000 hours. At baseline, 9 divided by 8,400 and multiplied by 1,000 equals 1.0714, reported as 1.07.
The case criteria are met, but the event count remains small. The team reports a period observation and does not calculate capability, statistical significance, or a reliability promise. Base preparation, soft-foot correction, alignment, and flush verification entered as one package, so the pilot validates the combined standard. It cannot assign the observed movement to one element.
Completed Control decision
The process owner approved the controlled task-list version for P-204 A and B while holding rollout to other pumps for an applicability review. Control requires a post-torque reading on every assembly, monthly review of events per exposure, and another decision after 3,000 additional hours. An event inside the first 1,000 hours, a missing reading, or more than 45 added minutes triggers containment, order review, and return to Analyze.
Control without false statistical confidence
The control plan names each characteristic, source, frequency, owner, visualization, and reaction. Events per exposure monitor the outcome. A post-torque reading checks the process. Intervention duration and safety deviations serve as balances. Missing data have an explicit disposition instead of silently disappearing.
Control limits describe observed variation in a stable process. Engineering specifications or acceptance limits express requirements. One cannot replace the other. The case estimates statistical limits only after definitions remain constant and a coherent series with adequate observations exists. Until then, a run chart with change annotations and qualitative reaction rules is more honest.
Chart choice must match data and denominator. Event counts with changing exposure require a different method from an individual continuous reading. The team records assumptions and refuses to publish three-sigma lines merely because software offers the option. A special cause signal launches the documented response; limits are not recalculated just to absorb an uncomfortable point.
Capability is considered only after stability and after distribution or analytical assumptions are reasonable. A single index cannot replace a histogram, time order, sample size, and physical understanding. When regimes produce different behavior, the project keeps them separate or reports the resulting uncertainty.
| Controlled characteristic | Evidence | Defined reaction |
|---|---|---|
| Final alignment after torque | Reading file linked to the work order | Stop testing, correct the condition, and repeat measurement |
| Flush flow before startup | Value and operating condition recorded | Request technical evaluation before release |
| Recurrence under comparable hours | Notification related to the earlier intervention | Reopen analysis and preserve removed components |
| Job duration | Operation-level confirmations | Review resources and sequence without deleting critical controls |
Build traceability in SAP PM
The notification preserves the event, observed condition, and consequence. The order turns an approved pilot into operations, resources, materials, and dates. Confirmations show work progress and actual hours. Documents and measurements support acceptance. A task list receives the revised sequence only after technical approval.
A reviewer should navigate from the repeat event to the preceding order, instruction version, confirmation, installed material, and alignment evidence. That relationship is more valuable than a long paragraph copied across fields. Damage, cause, and activity codes require stable governance across plants if they are used for analysis.
Explore root cause analysis in maintenance for deeper causal work, and use the maintenance Pareto guide to structure frequency. The paper forms and rework analysis addresses execution evidence.
Evidence checks across the five phases
- Define to Measure: defect, population, exposure, boundary, and owners are approved. Ambiguity pauses collection before incompatible events are combined.
- Measure to Analyze: sources reconcile and classification is fit for the decision. Relevant disagreement sends the measurement process back for improvement.
- Analyze to Improve: the priority cause has a mechanism, prediction, and evidence that survived alternatives. Correlation alone cannot authorize the pilot.
- Improve to Control: implementation met its criteria, risk was accepted, and minimum exposure was observed. An incomplete action does not become standard work.
- Closure: the process owner accepts the reaction plan, controlled documents are updated, and a stability review has a date.
The executive review receives a concise record of problem, baseline, measurement confidence, supported cause, pilot, result, uncertainty, and decision. Technical appendices keep the audit trail. This format lets leaders challenge the chain rather than discuss only a green status.
Where PM Run supports the work
PM Run is a planning, mobility, and execution layer over SAP PM. Within the pilot, Planning brings capacity, shift, and skill constraints into the schedule while keeping orders integrated with SAP. Mobility can return readings, notes, and permitted evidence tied to the performed operation. SAP remains the system of record for technical objects and maintenance history.
The platform does not calculate root cause, set statistical limits, approve task-list changes, sense equipment, or predict failure. Automated data can support analytics built by the operation, but PM Run does not promise a ready-made analytical view. Engineering, reliability, planning, and operations retain their decision rights.
Senior review questions
What if the dataset is still small?
Keep definitions stable, display counts and denominators, state uncertainty, and avoid indices whose assumptions are unmet. Work may still improve collection or test a strong mechanism when the decision remains proportional to available evidence.
Can an internal target become a control limit?
A target states direction, a specification states a requirement, and a control limit estimates process behavior under assumptions. They may share a chart only when labels and meanings stay distinct.
Does order closure finish Control?
Closure demonstrates completion under the local maintenance process. Effectiveness still depends on defined exposure and later monitoring. The result remains pending while the pump has not accumulated comparable hours.
How does Analyze avoid becoming a debate?
Every cause explains a mechanism, predicts an observation, identifies a source, and admits evidence that would weaken it. The session ends with tests and owners rather than a vote for the most familiar story.
Technical sources
- ASQ, DMAIC Process, professional reference for phase outcomes.
- NIST, Process Capability, neutral statistical guidance on stability and capability.
- NIST, Control Charts, reference for process monitoring.
- SAP Help Portal, Maintenance Order, official documentation for the execution object.