
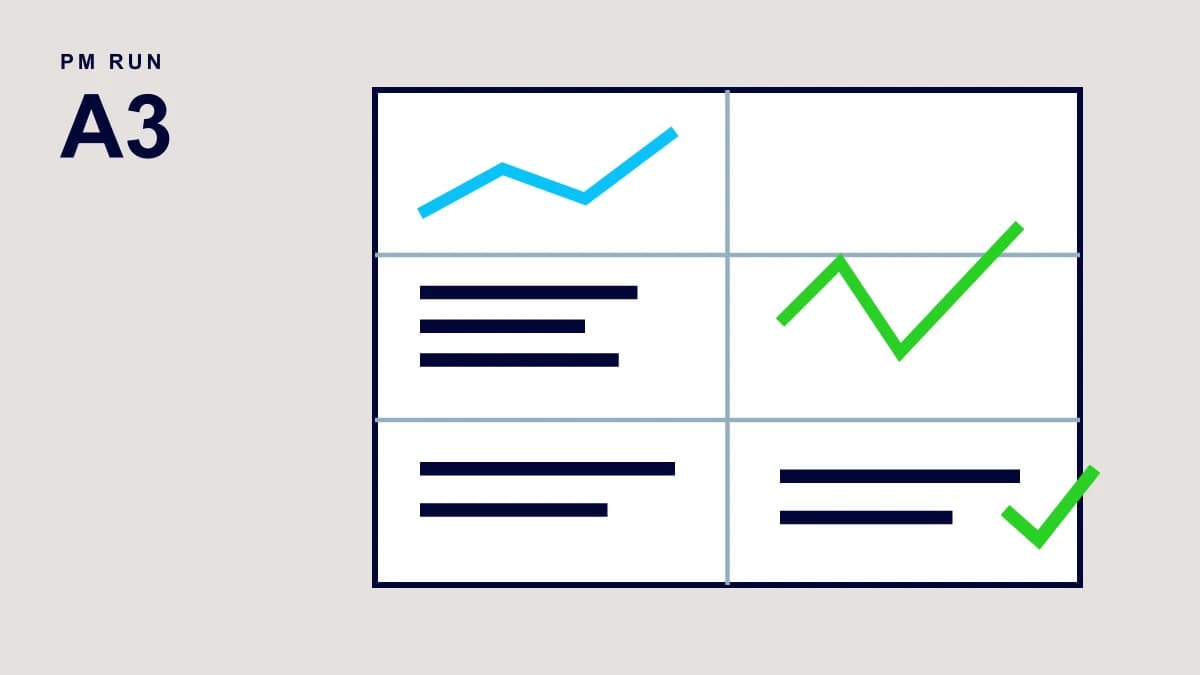
An A3 report is a single-page document, the size of an A3 sheet, that records how a problem is solved from start to finish: background, current condition, goal, root cause analysis, countermeasures, action plan and follow-up. In maintenance, it is used for chronic failures and losses that need more than one department to be solved.
The sheet follows the logic of the PDCA cycle: the left side holds the planning, and the right side holds execution and verification. The space limit forces the team to choose what matters and makes the reasoning visible to whoever needs to approve resources, a clear gain for maintenance management.
What is an A3 report
The A3 was born at Toyota as a standard way to propose and follow improvements. The name comes from the paper size (297 × 420 mm), the largest that fit in a fax machine. The Lean Enterprise Institute describes three uses: problem solving, proposals and status reports. In maintenance, the first is the most common.
An A3 has an owner, usually the person leading the analysis, and a mentor, who reviews the sheet and asks questions. That conversation is part of the method: the sheet is rewritten until the reasoning holds up.
A3 report structure
Left side: understand the problem
- Title: the problem in one sentence, without the solution built in.
- Background: why this problem matters now, with its impact on safety, production or cost.
- Current condition: how the problem shows up today, with data, simple charts and, if it helps, a process sketch.
- Goal: the expected result, with an indicator, a value and a deadline.
- Root cause analysis: the confirmed causes, with the tool used (Ishikawa, Five Whys, Pareto).
Right side: solve and verify
- Countermeasures: what changes in the process to address each confirmed cause.
- Action plan: who does what, by when.
- Follow-up: how and when the result will be checked, and what happens if it is not reached.
A3 report example in maintenance
The example below is illustrative, with round numbers, to show the level of detail that fits in each block.
| Block | Completed content |
|---|---|
| Title | Recurring belt conveyor stops caused by belt mistracking |
| Background | The conveyor feeds the filling line and has no standby unit. Every stop halts the whole line. |
| Current condition | 10 stops in 3 months, 2 hours each on average, 20 hours of line downtime in total. 7 of the 10 happened in the two weeks after a belt replacement. |
| Goal | No more than 1 mistracking stop in 3 months, starting from the next belt replacement. |
| Root cause analysis | 6M Ishikawa with field verification. Confirmed causes: belt tensioning done without a reference value and a return idler with a seized bearing. Ruled out: belt splice out of square (inspection found no deviation). |
| Countermeasures | Set a tension value and add the measurement to the replacement task list. Add return idler inspection to the monthly preventive. |
| Action plan | Revise the task list (planner, 2 weeks). Buy a belt tension meter (purchasing, 3 weeks). Train both shifts (supervisor, 4 weeks). |
| Follow-up | Count mistracking stops monthly for 3 months after the next replacement. If there are 2 or more, reopen the analysis. |
Notice what the example leaves out: there is no list of every idea raised in the meeting, no record of who said what, and each countermeasure targets a confirmed cause, one by one.
How to fill in an A3 block by block
Fill it in order, top to bottom and left to right. Jumping straight to countermeasures is the shortcut that turns the A3 into a justification for a decision already made.
- Current condition with data. Use the asset's work order and notification history. If the data does not exist, the first step of the A3 is to collect it.
- A measurable goal. "Reduce stops" is too vague. A number, an indicator and a deadline tell you whether the problem was solved.
- A confirmed cause. Distinguish hypothesis from verified cause. The Ishikawa diagram helps raise hypotheses; confirmation comes from inspection, measurement or testing.
- Countermeasures tied to causes. Each countermeasure should point to a cause in the previous block. A countermeasure with no matching cause is a wish.
- A short plan. If the action plan needs more detail, attach a 5W2H action plan and keep only the main actions on the sheet.
- Dated follow-up. Mark the check dates on the sheet and record the result of each one.
Mistakes that turn the A3 into decoration
- A sheet filled in after the problem was already solved, only to satisfy an audit.
- Tiny print and too many charts, because the team would not choose what matters.
- Current condition described as opinion ("that belt always gives trouble").
- Generic countermeasures, such as "raise awareness" or "reinforce training", with no process change.
- Follow-up that ends with the action plan deadline, without checking whether the result held.
A3, PDCA and 8D
The A3 is a way of recording a PDCA cycle, so it suits medium-sized problems: big enough to need analysis, small enough to fit on one page. The 8D method is more formal, with immediate containment, a defined team and escape point analysis, and is usually preferred when the problem involves an external customer or a supplier. In many plants, both coexist: 8D for serious incidents and A3 for internal improvements and chronic failures.
Linking the A3 report to SAP PM work orders and PM Run
The A3 describes the decision; the execution happens in work orders. To keep the sheet tied to real work, record on it the numbers of the orders and notifications used in the current condition and of the orders that carry out the countermeasures. In SAP PM, changes to task lists and maintenance plans stay in the master data, and the follow-up block relies on the asset's order history.
The quality of that history depends on what comes back from the field. With PM Run Mobility, technicians confirm each work order operation on the phone, follow the long-text checklist and record measurements and photos, while PM Run Planning helps fit the action plan orders into the schedule, considering capacity and priority. The A3 follow-up then uses execution data instead of the team's recollection. Learn more about PM Run Planning.
Frequently asked questions about the A3 report
Does an A3 report have to be on A3 paper?
Not necessarily. The name comes from the paper size, and many companies use a digital template. What matters is keeping the one-page limit, which forces synthesis.
What are the sections of an A3 report?
Title, background, current condition, goal, root cause analysis, countermeasures, action plan and follow-up. Some versions merge background and current condition into one block.
What is the difference between an A3 report and an 8D report?
The A3 records a PDCA cycle on one sheet and is used for internal problems and improvements. The 8D is a more formal method, with eight disciplines, immediate containment and escape point analysis, common in customer complaints.
Who should write the A3 report?
The person leading the problem analysis, such as a maintenance engineer, supervisor or planner. A mentor, usually the manager, reviews the sheet and challenges the reasoning until it holds up.